PV-DiStAns 2.0
The project is divided into four basic sub-areas or phases. First of all, within the framework of workshops, bilateral agreements in cooperation with insurance companies and experts, critical types of errors and conditions in photovoltaic systems and their damage effects are to be determined and evaluated in an FMEA (Failure Mode and Effect Analysis). On the one hand, this can have economic effects, e.g. aging of the PV modules, as well as safety-related effects, such as e.g. short circuits and arcing.
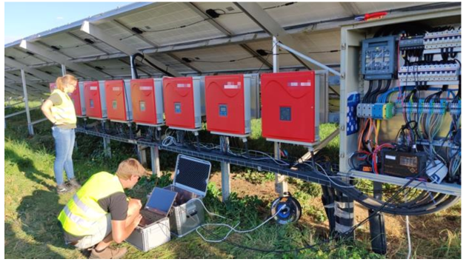
The second part of the project deals with the detection of typical leakage current signatures of photovoltaic systems in different network and operating states. For this purpose, selected systems are equipped with measuring technology and measured over a period of several months in order to take seasonal fluctuations into account. The results or time series determined from this measurement campaign are used to define the “normal” behavior of the leakage current in a database, e.g. as a training basis for AI-based fault detection algorithms.
The aim of the third phase of the project is to reproduce the behavior determined in the second part of the project in the laboratory and to simulate selected error cases. For this purpose, a laboratory test stand is being developed and set up, with which the behavior of the photovoltaic systems measured in the field is modeled on the basis of the time series determined. During the laboratory tests, selected faults from the first phase of the project are simulated in order to determine the behavior of the leakage current in the event of a fault. This procedure has the advantage that the errors do not have to be generated in the field, which in many cases is not even possible. In addition, it is possible with the test stand to generate reproducible results and to operate the photovoltaic system in operating states outside of the normal operating range.
In the fourth phase, the results from the field measurements and the laboratory tests are evaluated for recognizable connections and the results are published or made available.
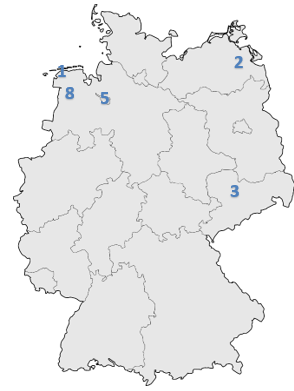
Examined photovoltaic systems and parks
Nr.1 NORDDEUTSCHLAND 2300kWp free field
Nr.2 MITTELDEUTSCHLAND OST 2800kWp free field
Nr.3 MITTELDEUTSCHLAND 4800kWp free field
Nr.5 NORDDEUTSCHLAND MITTE 13,4 kWp roof
Nr.8 NORDDEUTSCHLAND WEST 4kWp roof labor
Data analysis and evaluation of the anomalies
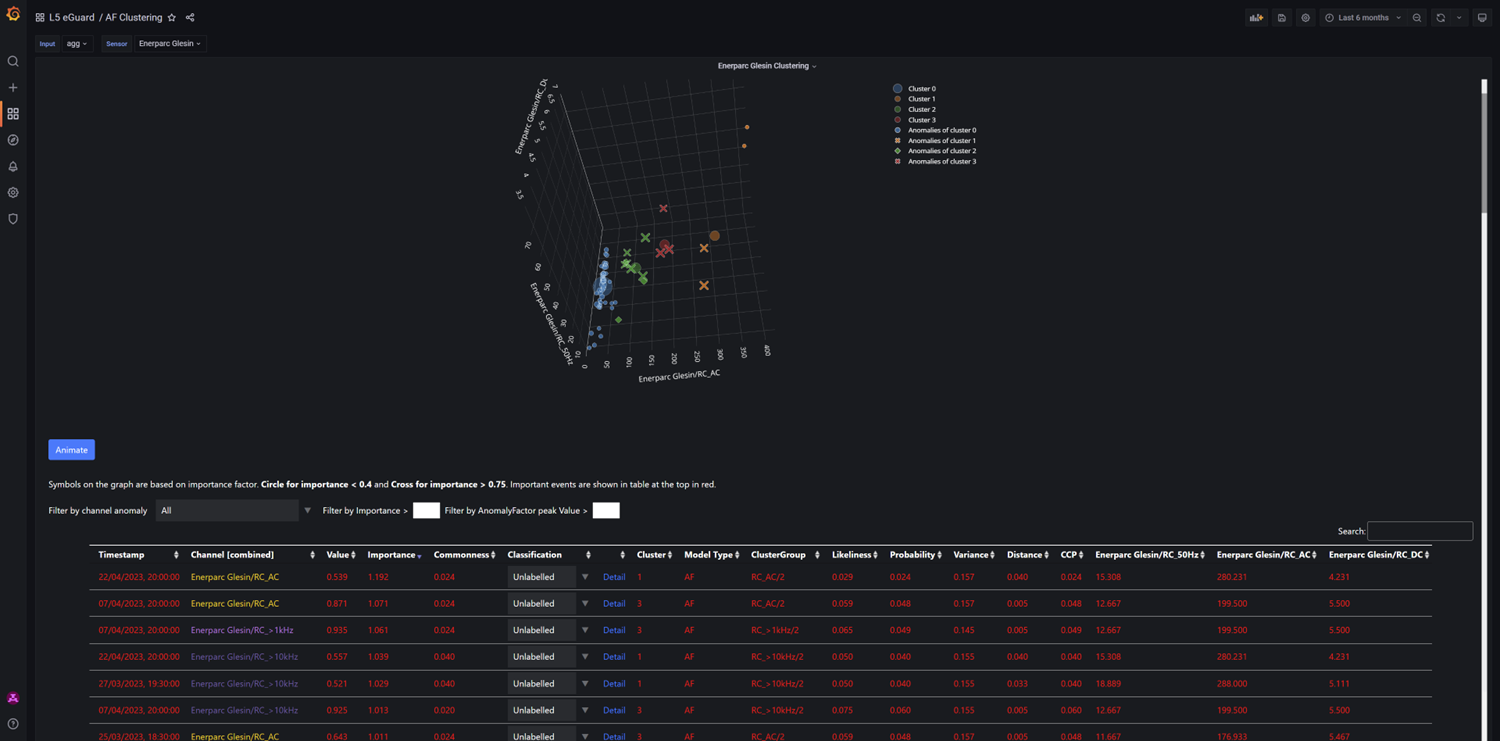
PV-Parc MITTELDEUTSCHLAND
6 months Cluster View shows several distinct anomaly centers of gravity which indicate e.g. damaged or corrupted capacitors
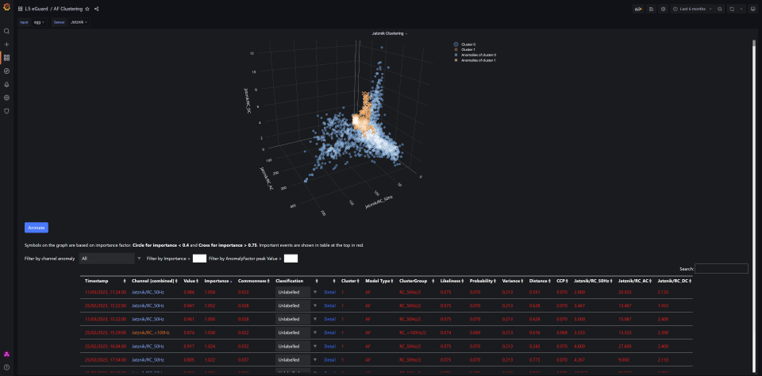
PV-Parc MITTELDEUTSCHLAND OST
6 months Cluster View shows high number of high value outlyers which indicate inverters changing their working points way too oftern and causing outages and corrupted inverters as consequence
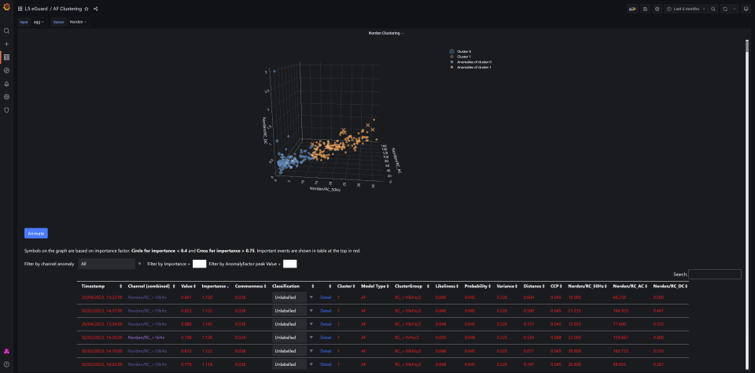
PV-Parc NORDDEUTSCHLAND
6 months Cluster View shows quite normal spread of working points (way lower displacement) with some potential problems in winter time
GET IN TOUCH
Would you like to see everything in detail? Then get access to the data analysis here.
Team & Mitwirkende
Name
Position
Name
Position
Name
Position